
- Support center home
- Machool overview
- Account setup
- Account management
- Making a shipment
- E-commerce
- Bring your own account
- Import recipients
- Shopify advanced shipping rules
- WooCommerce advanced shipping rules
- Batch shipping
- Custom package templates
- Machool Bulk Ship
- Advanced shipment notifications
- Service Provider support
- Adjustment charges
- Deliver to local pickup location
- Machool API Solution
- Schedule a Pickup
- Machool’s Analytics Center
- Presets
- Direct Print
- Machool Wallet
- Support center
- Return Portal
- Zonos Integration
Understanding Machool's Analytics Center
Machool's Analytics Center is a powerful tool designed to provide users with comprehensive insights into their shipping activities. This feature enables you to track and analyze your shipment creation activity, providing valuable data to help optimize your shipping strategies.
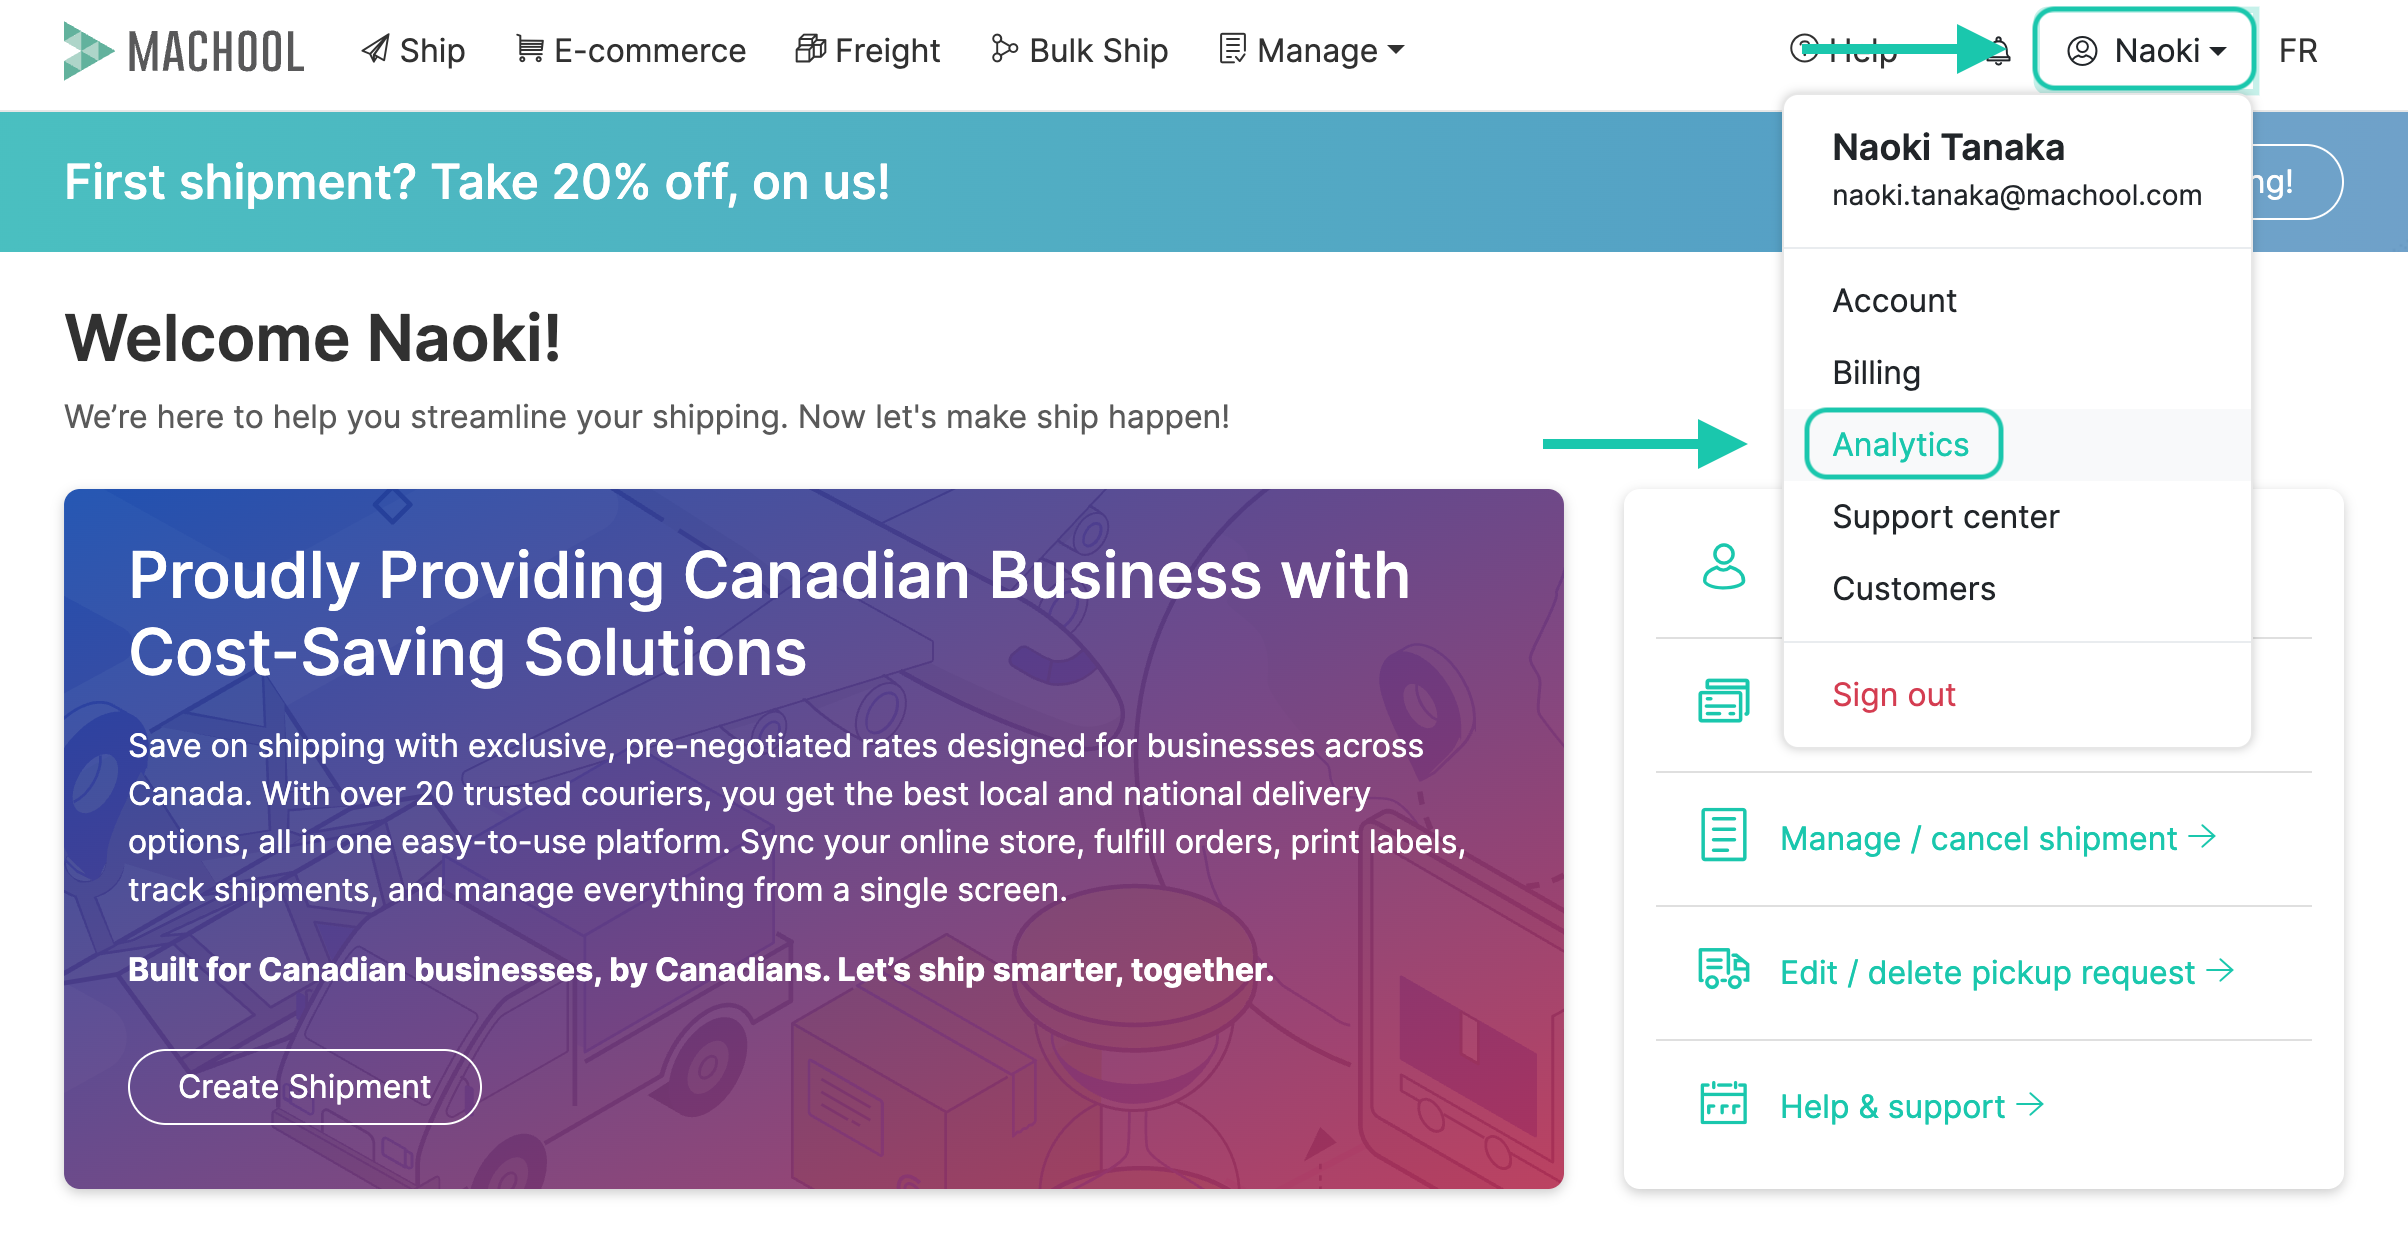
Accessing the Analytics Center:
To access the Analytics Center, navigate to your account by clicking on your account name in the upper right corner of the screen. From the dropdown menu, select "Analytics."
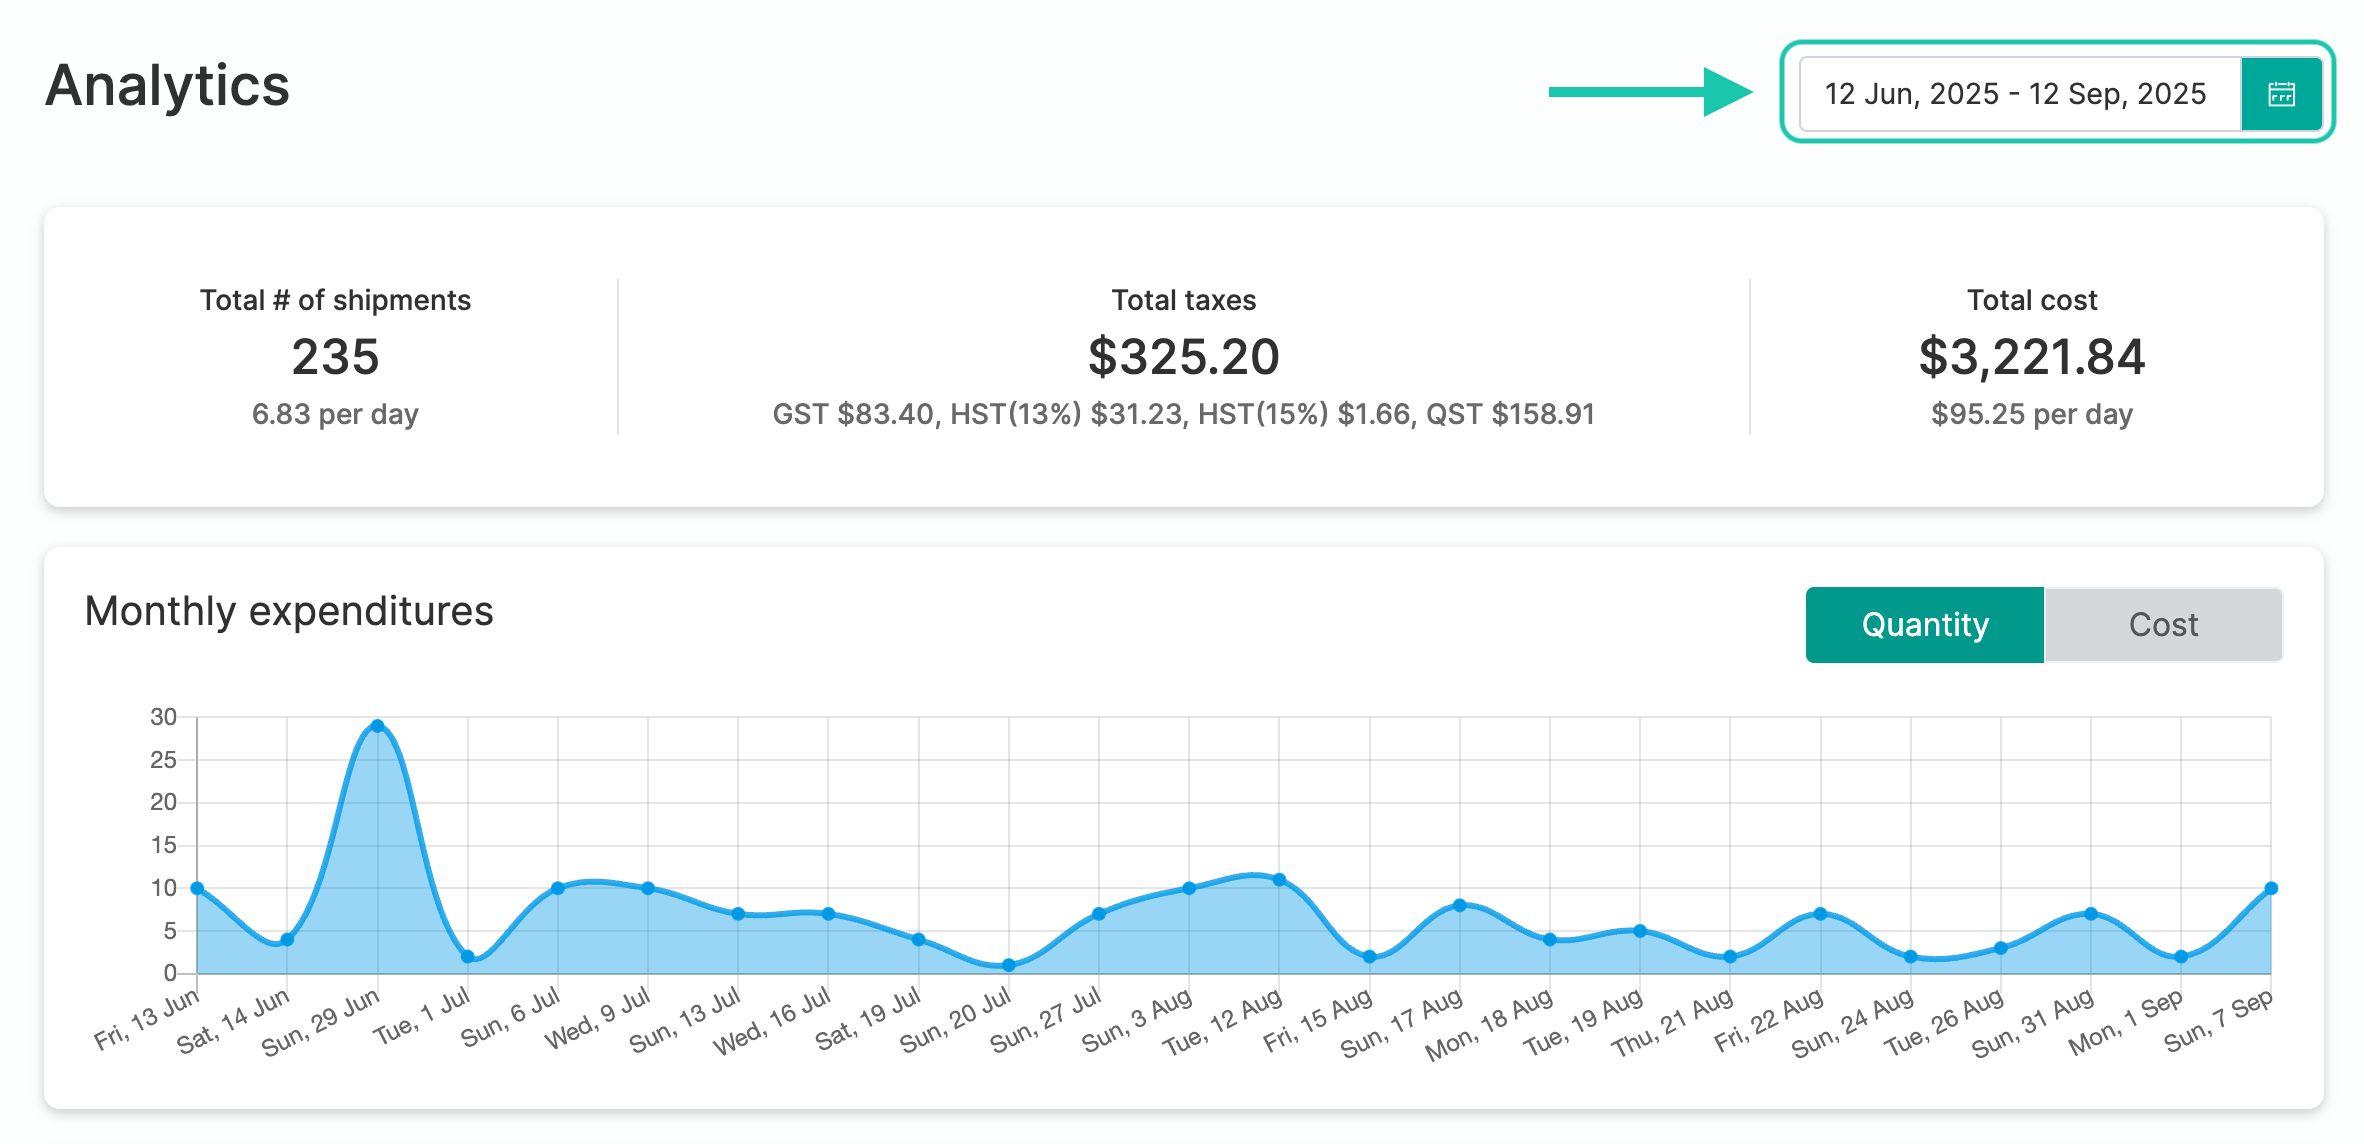
Upon entering the Analytics Center, the default view displays data for the last 7 days. However, you can customize this view by clicking on the date range picker and selecting the desired time frame.
Key Features:
The main feature of the Analytics Center is a graphical representation of your shipment creation activity during the selected time period. This graph provides a visual overview of your shipping trends.
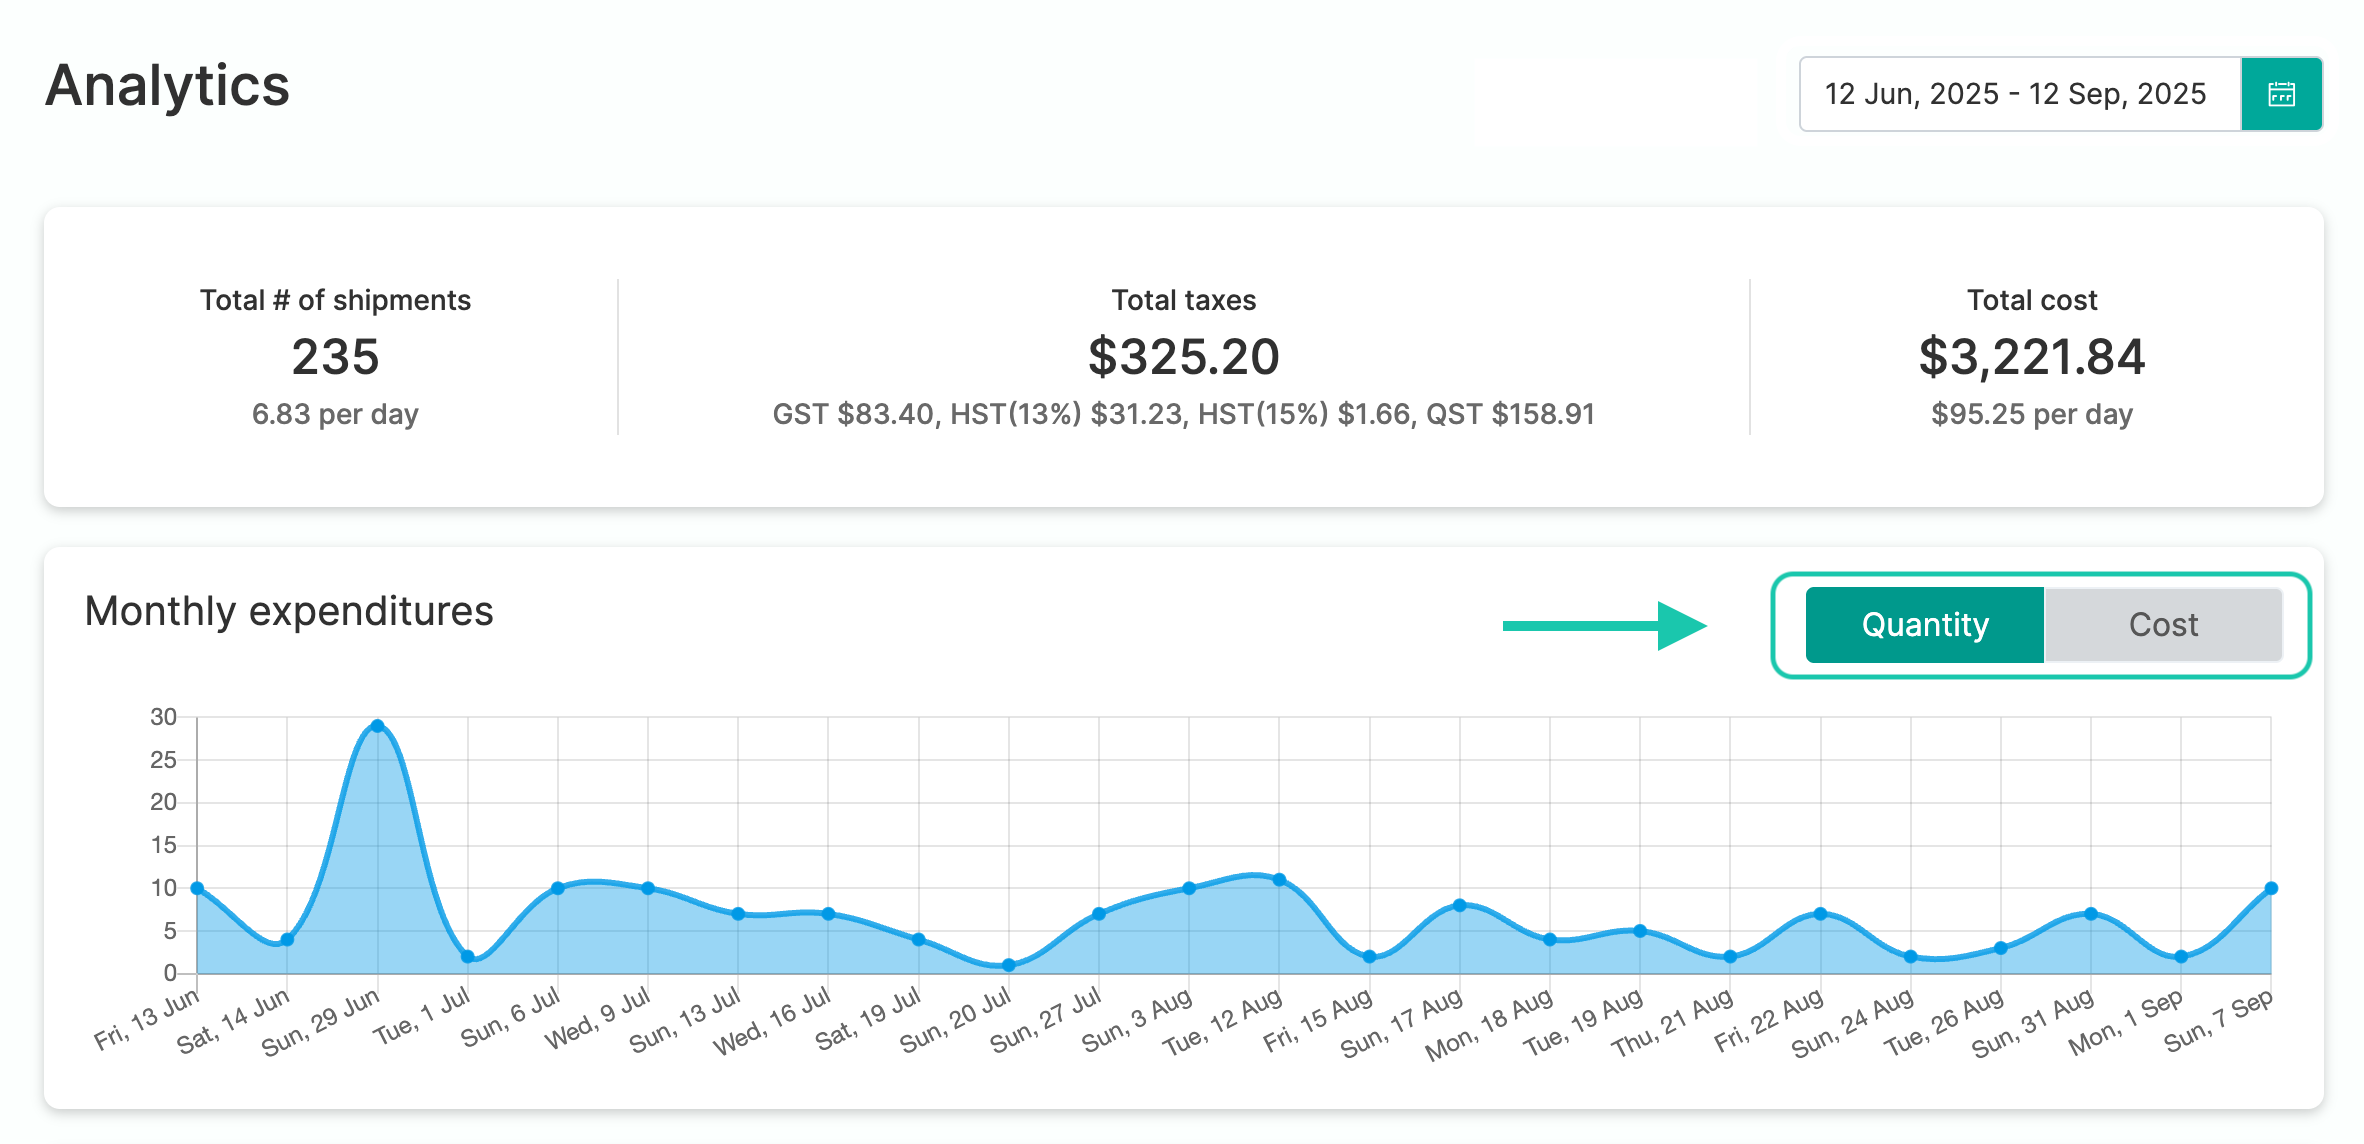
You have the option to toggle between viewing the graph as the number of shipments created or the total cost incurred. This flexibility allows you to assess your shipping activity based on quantity or expenditure.
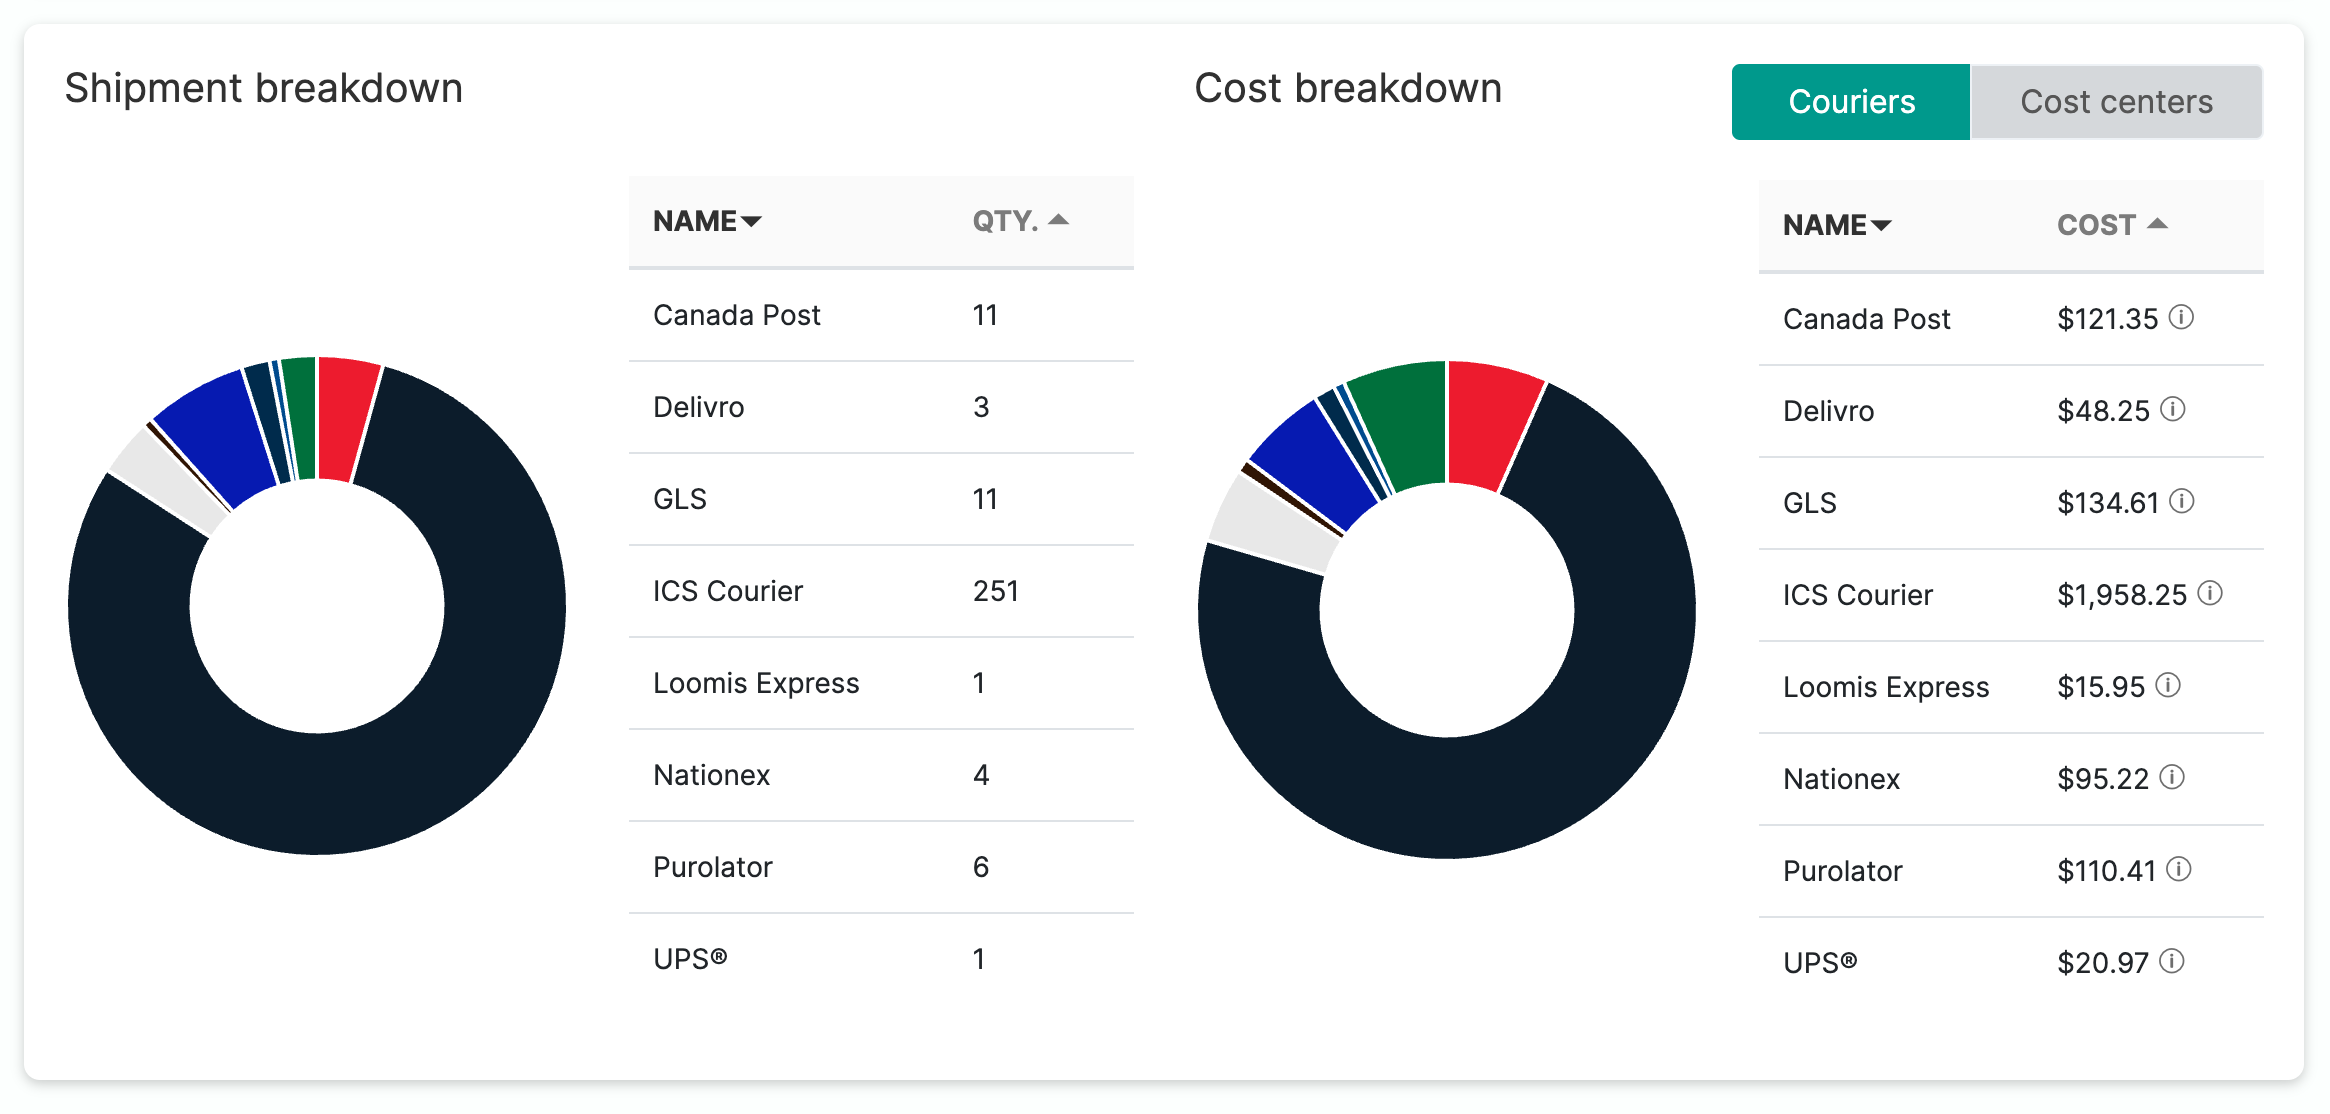
Scroll down to find a detailed breakdown of your shipment quantity and cost per courier used within the selected time frame. This breakdown provides valuable insights into your shipping patterns with different carriers.
Machool's Analytics Center empowers users to make informed decisions based on comprehensive shipping data. By leveraging this tool, you can optimize shipping strategies, identify cost-saving opportunities, and enhance overall efficiency in managing your shipments. For further assistance or queries regarding the Analytics Center, please don't hesitate to contact our support team. We hope this guide helps you harness the full potential of Machool's Analytics Center for your shipping needs!